A4: VBA Programming For Excel
Due dates for all assignments can be found on the [graded
components]
section of the course webpage.
Background information (by James Tam).
JT: assignment requirements aren't directly included in this section and the
reader looking only for that information can skip directly to the text under the
next heading "Starting
files that you should modify and submit". The background information is
provided for those who are interested in the motivations behind the creation of
a program to track infection rates which eventually became the genesis for an
assignment in CPSC 203.
Sometime after infections began to occur in Canada there was constant message
about the need to "flatten the curve" (a decrease in the slope of a function
that plots infection rates) and things that could be done to attain that goal.
To keep the public informed about the progress of the infections, agencies such
as Alberta Health Services (AHS) would release information that included:
infection rates, age demographics, gender as well information about the people
who had unfortunately succumb to the illness. Figure 1 graphs the information
about the progress of infection rates and fatalities based on the AHS
information. This graph was created from actual AHS data and the instances of
new infections and fatalities were counted and graphed automatically using an
Excel VBA program.
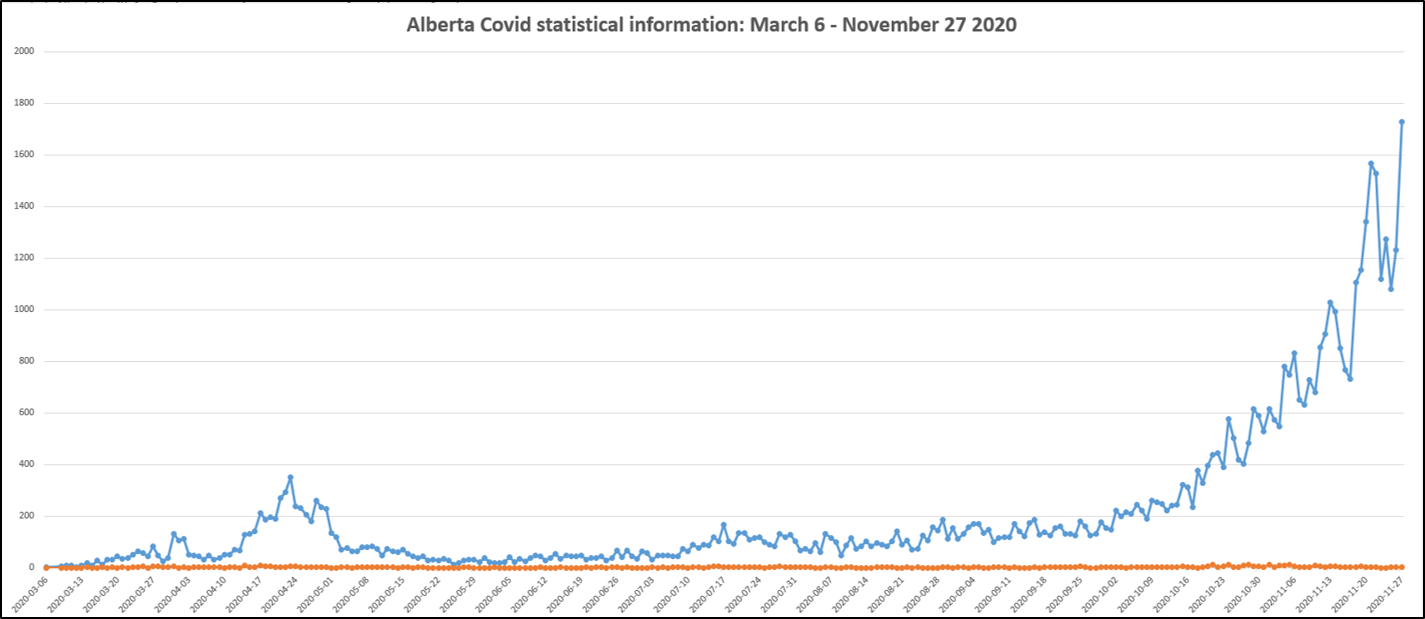
Figure 1: Graphing new infections
vs. number of infected people who have passed away.
In the early days of the
infections in the spring when the number of new infections was lower, the number
of new infections vs. those who died could be done in one graph. The difference
between the numbers wasn't so large that trends could still be seen over time.
With the increase in infection numbers in the fall it may be easier to determine
trends by two separate graphs (Figure 2).
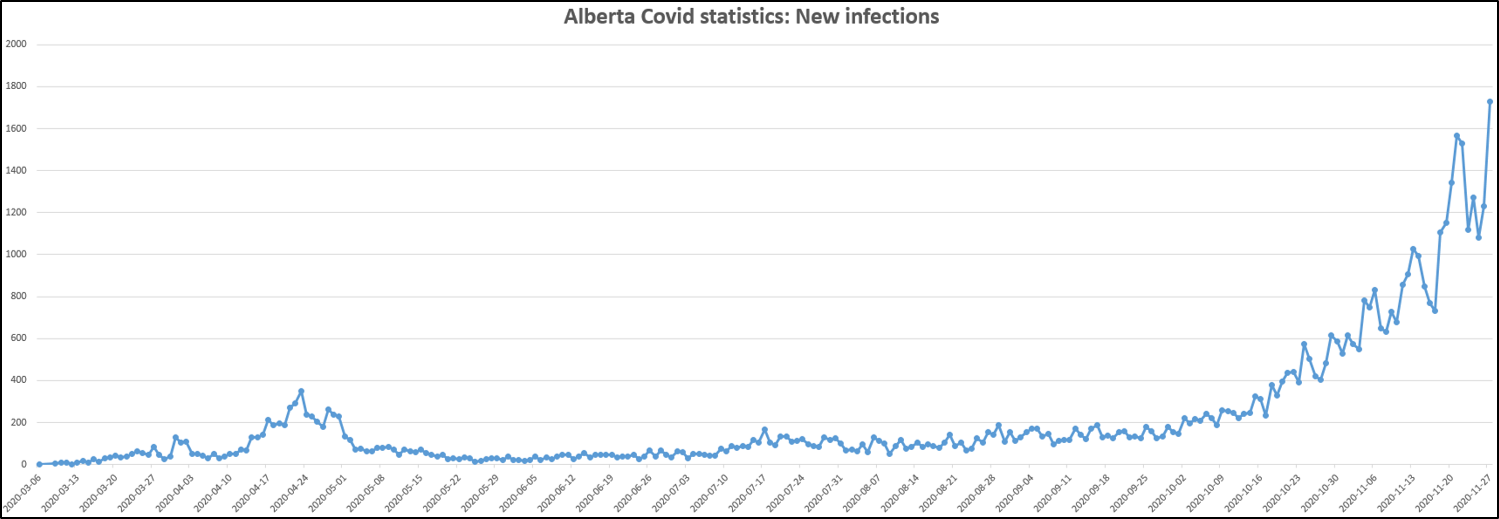 |
| Figure 2A: Number of new
infections |
| |
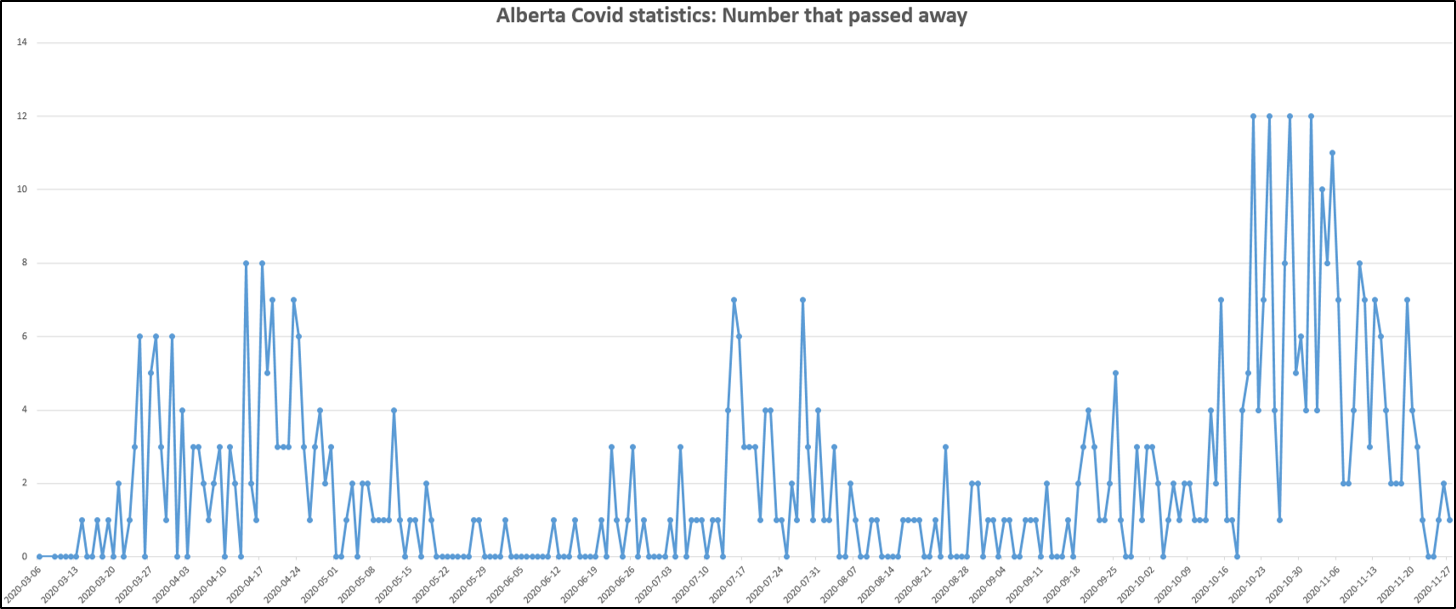 |
| Figure 2B: Number of people who
passed away |
Of course it is easier to see
change in the infection rate if only new infections are charted. While it may be
possible to see the decreasing curve when charting total infections at a
particular point in time it's harder to see trends until they become extreme.
While I was happy to view other people's pre-created visualizations I found that
information available last spring lacking. Like everyone else I wanted to see a
sign of hope that things would get better (trying to keep "hope
in the heart" as it were) and because that information apparently wasn't
available for Alberta (it was for instance provided by the Quebec equivalent of
AHS) I ended up producing this information myself.
I found that AHS was quite open and transparent in the actual data regarding
infection rates and it can be found on the publically accessible website:
https://www.alberta.ca/stats/covid-19-alberta-statistics.htm. Click under
"Data Export" the page will display actual information about infections in
Alberta in tabular format. Each row is actual information about a person that
was infected with Covid in the province. (Since the information was available in
a public website I assumed that it met privacy requirements)> As of November 27,
2020 there were 56,444 people who were infected. Scroll to the bottom of the
page click on the "Excel" button to download an actual spreadsheet with this
information. Keep in mind that the data is set is large so at this point the
creation of the spreadsheet may take a fair amount of time. Don't close or
interrupt the browser until the process is complete.
With the raw data in hand I at first I had no desire to write a program to count
the infection numbers. I'm of the attitude why write a program if that
capability is already provided in the Excel functions. While graphing functions
abound in Excel, the ability to tally infection rates would be awkward (new
instances of the COUNTIF and
COUNTIFS functions would be needed for each day and the range would have
to be constantly updated as AHS added more rows of data to the information they
released. Thus I wrote a program that would help me visualization the
information.
Now of course many media outlets
have hired visualization specialists to not only graph the progress of the
disease over time but some have even created animated changes over time or
interactive displays. So there is very little need for an individual person to
plot the information on their own. However, I still decided to use the gist of
the problem as an assignment: the plotting of Alberta Covid data. It seemed
appropriate - since the exam components were dropped because it was a distance
learning semester required by the Covid pandemic and a new assignment and at
least one workbook exercise was needed to fill the gap - an assignment about the
pandemic seemed appropriate. Plus it provides students with experience analyzing
and visualizing a large data set from a compelling real world problem. Finally
past students have asked me to include an Excel VBA programming component
because they have indicated, for their area of study at least, that there are
job opportunities requiring knowledge of Excel VBA programming. So this
assignment seemed to fill all these needs.
-
A Excel macro enabled
spreadsheet: [A4_Covid_Data].
This file is a macro enabled Excel spreadsheet that you can use to contain
or save your program. Figure 3 shows the macro being saved to spreadsheet
for workbook exercise. For this assignment you should save your A4 macro
into the A4_Covid_Data spreadsheet. You are given starting data as a
convenience. Your program should not be written only to handle the data in
this file (in this file it's just over 600 Covid cases). Instead your
program must be written so that the program features work for any data set
so that the spreadsheet is laid in the same format as this spreadsheet (e.g.
the dates are in Column B, the cases status is in Column B).
-
Word 2007 document: [A4_backup].
Copy-paste your program into this document in order to back up your work.
It's critical that you
save (or contain) your macros in the above spreadsheet
when you first create the macro (via
View->Macros
in the Excel ribbon).
DO NOT save it in "All Open workbooks". Doing the latter will save your
macro in another spreadsheet that is local to your computer. (This means that
when your marker downloads your submission the code will not be available and
you will receive a zero).
Figure 3: Saving the
macro in a container spreadsheet that allows macros to be enclosed (.xlsm)
Periodically you should back up your spreadsheet (e.g. at the very least upload
it into D2L) and you should copy-paste your program into the provided Word
document (and submit that into D2L as well). That way you will have a fall back
if disaster strikes and you have a copy to retrieve. While you aren't directly
required to copy your work into a Word document and to back it up (by uploading
into D2L and other means) this information is included in the assignment
description for your benefit. It may give you a fall back if things don't go
well. If you ignore these suggestions and run into problems then you will not
be given any special considerations (e.g. extra time, resubmitting the work,
alternative forms of evaluation etc.)
Write a VBA macro that includes the following features
(failing to follow style requirements can
affect your grade).
All the features
must be implemented with Excel VBA instructions. No credit will be awarded if
the feature is simulated by invoking the feature via the Excel ribbon or via an
Excel function such as COUNTIF.
The use of VBA functions (e.g. MsgBox)
and methods (e.g.
ActiveSheet.Shapes.AddChart2) is not only
'allowed' but it is required. Of course manually typing information such as the
infection count into the spreadsheet will earn no credit.
New as of Dec 1: I change requirements after
something has been posted but this change adds an alternative acceptable
solution for Features 7 & 8. (If you implement these features using nested loops
or if you implement these features using a single loop that only contains nested
IFs and not a nested loop you can be awarded full
credit provided all other requirements are met). Since the change provides you
with an additional acceptable way of completing the assignment (you don't have
to change a thing if you already wrote your solution using nested loops) it
shouldn't cause you any problems. [Lecture
example where nested loops is used] [Alternative
solution to the lecture example without nested loops]
-
Write the text "Total cases" into the cell
I1.
(0.2
GPA)
-
Counts the total number of Covid cases
(includes all cases status such as 'Recovered', 'Active' etc.) and displays
this information in a MsgBox
when the program has counted all the infection numbers in the spreadsheet.
The count must be conducted with
a loop and variable is used to track the count. (1.1
GPA)
-
Writes the count from the previous feature to
Cell J1.
(0.2
GPA)
-
The two Cells where the information written
from the previous two features are bolded. (0.1
GPA)
-
The data in the spreadsheet is sorted by date
(earliest to latest).
(Max
0.3 GPA
for sorting)
- Only a hard-coded (fixed)
range such as B2
to G21
is sorted. (0.1 GPA)
- All rows which contain Covid data
will be sorted. If there are two rows of data then only those two rows
will be sorted. If there are 55,000 rows then all those rows be sorted.
This is obviously the superior approach because the number of cases may
increase over time. (0.3
GPA
)
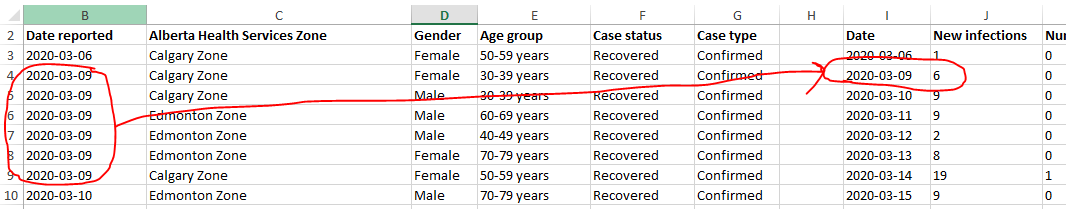
The date in which infection data appears
in the spreadsheet (i.e. the entry of a date in the rows of Column
B
signify that an infection occurred on that date) will be written into Column
I.
Regardless of the number of infections that occurred on a particular day,
the date information is only written into Column
I once.
[Image] (0.4
GPA)
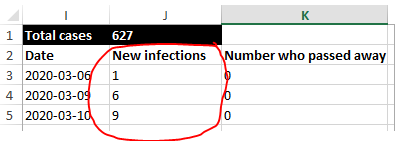
(Nested loops mandatory) The number of
new infections for a particular date are written into the rows of Column
J
with the first date appearing at Cell
J3. Because the date only appears once
in Column I
the number of infections for a particular day will appear only once on one
row. [Image] (0.6
GPA)
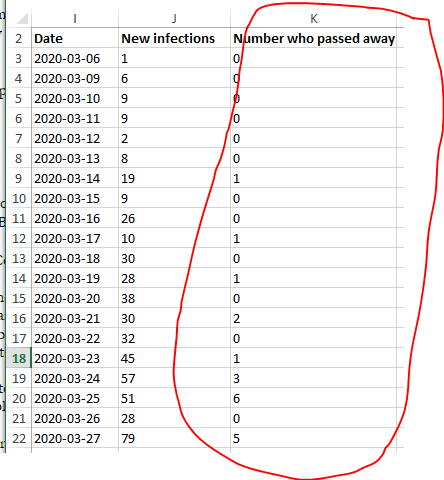
(Nested loops mandatory) The number of
people who passed away on particular date will be written into the rows of
Column K.
Similar to new infections only the total number of people who passed away on
a particular date will be written and written once. [Image]
(0.6
GPA)
(To get credit for this feature the
previous 3 features need to correctly and completely implemented). Insert a
chart that graphs: the date, number of infections for each date, the number
who passed away on each date. Whether one chart is used for new infections
and deaths, or one chart graphs infections over time while the other graphs
deaths over time the same credit will be awarded.
Acceptable charts include: line, bar
or column. Unacceptable graphs for this type of data include: pie charts and
donut charts. Other graphs may be acceptable but avoid 3D representations
because they may not add any thing to the visualization and often make it
harder to interpret results. If you're concerned that your choice of graph
will affect your grade it's best to stick to one of the 3 specified types
and use a 2D form only. Similar
to the feature where you sort the data, the graph should only include in
it's range rows that contain Covid data. A fixed range based on number of
cases that happen to be found in a particular spreadsheet should not be
used. (0.3
GPA)
(Requires the previous feature to be
complete and correct). The chart title must be changed to include the text
"Alberta Covid statistics". If you have a separate chart for new infections
and deaths then each chart can include this text plus more specific
information e.g. "Alberta Covid statistics: New infections" and "Alberta
Covid statistics: Number of people who passed away". (0.1
GPA)
You can assume that infection data is continuous. Your program won't have to
handle a case where a blank line separates infection data The last infection
will be signified by an empty line.
Videos
-
Part I: Background information, not mandatory to complete your assignment
but it's for anyone is curious as to why I wrote a program to visualize Covid-19
data, how it became an assignment. [Link
to video]
-
Part II: Going over assignment requirements and showing the execution of my
solution. [Link
to video]
Documentation requirements
-
Contact information: your full name, student identification number. (0.1
GPA)
-
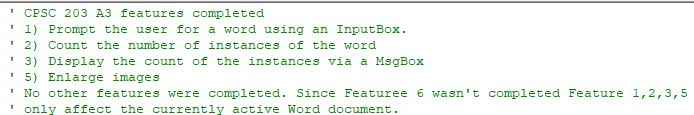
Specifying clearly what features of the assignment that you completed or
didn't complete. In order to get credit the documentation has to be clear
and complete. [Example] (0.3
GPA)
- Each level of code indenting is
consistently 1 tab. Instructions
in the sub-routine (between the 'sub'
and 'end-sub' is 1
level, the body of IF or WHILE structures
counts as another level of indenting. An IF within
an IF or WHILE within
a WHILE (or even
an IF within a WHILE or
a WHILE within an IF) each
count as another level. Penalty: -0.2 GPA applied
to any case (and not each case) where the required indenting is not applied
and applied consistently.
- Good naming conventions (e.g. variables,
sub-routines, the name of Word document containing the VBA program and
constants if applicable) are followed. Some examples of naming conventions
are provided in [the VBA Part I
notes]. Penalty: -0.2 GPA applied
to any case (and not each case) where poor naming conventions have been
used.
- The use of named constants (One of many
possible examples: Const EMPTY_CELL As
String = "") as
appropriate. Named constants were first introduced in the first VBA
programming set of notes. Examples have been shown in some of the subsequent
Word examples and many were shown in the two "VBA Extras" lectures.Penalty: -0.2
GPA applied to any case
(and not each case) where named constants could have been used but were not.
Submitting your work:
- The document must be electronically submitted
using D2L.
Reminder of what to submit. submit both the macro
enabled spreadsheet that contains your VBA program and the starting Word
document (with the code for your program copy-pasted here). While "you won't
lose" marks directly for excluding the Word document with the code you do so
at your own peril. If for some reason your program is not actually contained
in the spreadsheet that you uploaded into D2L then you will receive a grade
of zero. If the deadline has passed then you won't be given any special
considerations.
Your style grade will be
affecting, among other things, the naming conventions used. This includes
the name of the Word document containing your assignment. (See the
VBA Part I lecture notes for
stylistic conventions when assigning names. Keep in mind only the latest file is the
one that will be marked, everything else will be ignored (because it is not
fair to your marker to sort through multiple versions of your files).
Whatever name you have for the latest make sure that it's what you truly
want marked!
D2L configuration for this course
- Multiple submissions are allowed for this
assignment: You can (and really should) submit work as many times as you
wish before the due date. Due dates are strict, only what is in D2L by
the deadline is what will be marked. Other
methods of verifying that your work was completed on time (e.g. checking
timestamps, emailed files etc.) will NOT be accepted.
However only the latest version of all the files is what will be marked,
everything else will be ignored (because it is not fair to your marker
to sort through multiple versions of your files).
Do not use compression utilities (such as zip) or archiving utilities
(such as tar) otherwise your submission may not be marked. The space savings
in D2L is not worth the extra time required by the marker to process each
submission.
Make sure that you [check
the contents of your submitted files] (e.g., is the file okay or was it
corrupted, is it the correct version etc.). It's your responsibility to do
this! (Make sure that your submit your assignment with enough time before it
comes due for you to do a check).
Keep in mind when you submit VBA programs that even downloading and checking
the file won't work if you have saved your work in "all" spreadsheets rather
than the starting spreadsheet.
That's where copy-pasting the program into the Word
document may help.
Important points to keep in mind:
- Extensions may
be granted for reasonable cases by the course instructor with the receipt of
the appropriate documentation (e.g., a completed Statutory
declaration form that has been signed by appropriate Deponent, you can
get an appointment via the Office
of the Registrar). Typical examples of reasonable cases for an extension
include: illness or a death in the family. Cases where extensions will NOT
be granted include situations that are typical of student life: having
multiple due dates, work commitments etc. Teaching Assistants (the people
working in the 203 lab room) will not be able to provide extension on their
own and must receive written permission from the course instructor first.
(Note: Forgetting to submit/not properly submitting your assignment or a
component of your assignment in does not constitute a sufficient reason for
special grading considerations).
-
Collaboration: Assignments
must reflect individual work, group work is not allowed in this class
nor can you copy the work of others. To avoid problems students should not
see each others assignment solution.
-
Execution:
programs must work on the machines on campus Windows computers. (For the
remote learning semester since access to the lab computers is more
challenging: so the requirement is slightly relaxed and your file simple has
to work on any Windows computer). It's up to you to test and check this is
the case. Non-functional submissions will receive only partial credit (if
any at all).
-
Late
submissions:
|
Submission received: |
On time |
Hours late : >0 and <=24 |
Hours
late: >24
and <=48 |
Hours
late: >48
hours |
|
Penalty: |
None |
-1.5 GPA |
-3.0 GPA |
No
credit |
Marking:
-
If you have questions about your marking then the
first person to talk to is your marker and that will be the person who
teaches the tutorial in which you are officially registered. [Tutorial
information] If you still have questions after this first step then feel
free to contact your course instructor, just let me know that you talked to
your TA first.
-
TAs will download this sheet and each student will get
detailed feedback on this sheet (to be uploaded in the D2L Dropbox) about
how their grade point was derived: [Marking
spreadsheet].
- Marking feedback. You will get a detailed marking
sheet for each assignment that contains your TA's feedback. This marking
sheet is uploaded in your D2L Dropbox. If you don't know how to access files
that have been uploaded into D2L then follow this link [viewing
uploaded files in the D2L Dropbox]
Acknowledgment
I would to thank the AHS staff who provided me with the permission to use the
Covid-19 infection data for Alberta.